In the fast-paced landscape of today’s workplaces, understanding and nurturing employee engagement is paramount for organisational success. At the heart of this endeavour lies Engagement Analytics, a powerful tool that delves into the intricate dynamics between employees and their work environment.
Measuring Expectations, Fostering Fulfilment
Engagement Analytics serves as a compass, guiding organisations through the labyrinth of employee expectations and fulfilment. It meticulously gauges one’s employment expectations and evaluates the extent to which they are met within the organisational framework.
Imagine having a panoramic view of your workforce’s sentiments, aspirations, and contentment levels. The Organisational View for Engagement encapsulates this essence effectively.
From frontline employees to C-suite executives, Engagement Analytics paves the way for tailored engagement strategies that resonate with each individual. By leveraging data-driven insights, organizations can craft initiatives that address specific pain points, foster a culture of inclusion, and nurture a sense of belonging among their workforce.
How many departmental heads and team leaders would like to have the type of employee engagement expectation data shown in the attached graph? Good staff are expensive to replace – finding ways to keep them is crucial for productivity, keeping costs down and generally enhancing cultures to create attractive working environments. Expectations are divided into 8 groups, and participants are invited to score their degree of satisfaction within each group. This gives the team leader the opportunity to have a progressive coaching discussion and has the added impact of showing employees that managers are looking after their interests. The result – open, collaborative cultures with real employee expectations being met as far as humanly possible.
Visualise your Group Data
This is a snapshot of the high-level Organisational Analytics data available just across Employee Engagement Expectations. You can also get data for your people and your organisation on:
Senior and emerging leadership competency
Culture of your organisation
Collaboration and Team competencies
Team Dynamics
Emotional Intelligence competencies
Remote Working competencies
How helpful would this data be for informing your people development plans, culture and engagement programmes and succession plans?
You can find out more about Organisational Analytics here. leaders skills and competencies
If you would like to discuss how Organisational Analytics can help support your business objectives and people plans please contact Pat Hutchinson: pat@quadrant1.com or on 07768 922244
I often get asked to run time management courses. Managing time should be easy – write a list of things to do and get on and do them. So what gets in the way?
Take a look at this Paradox graph –
Harrison Assessment Paradox report
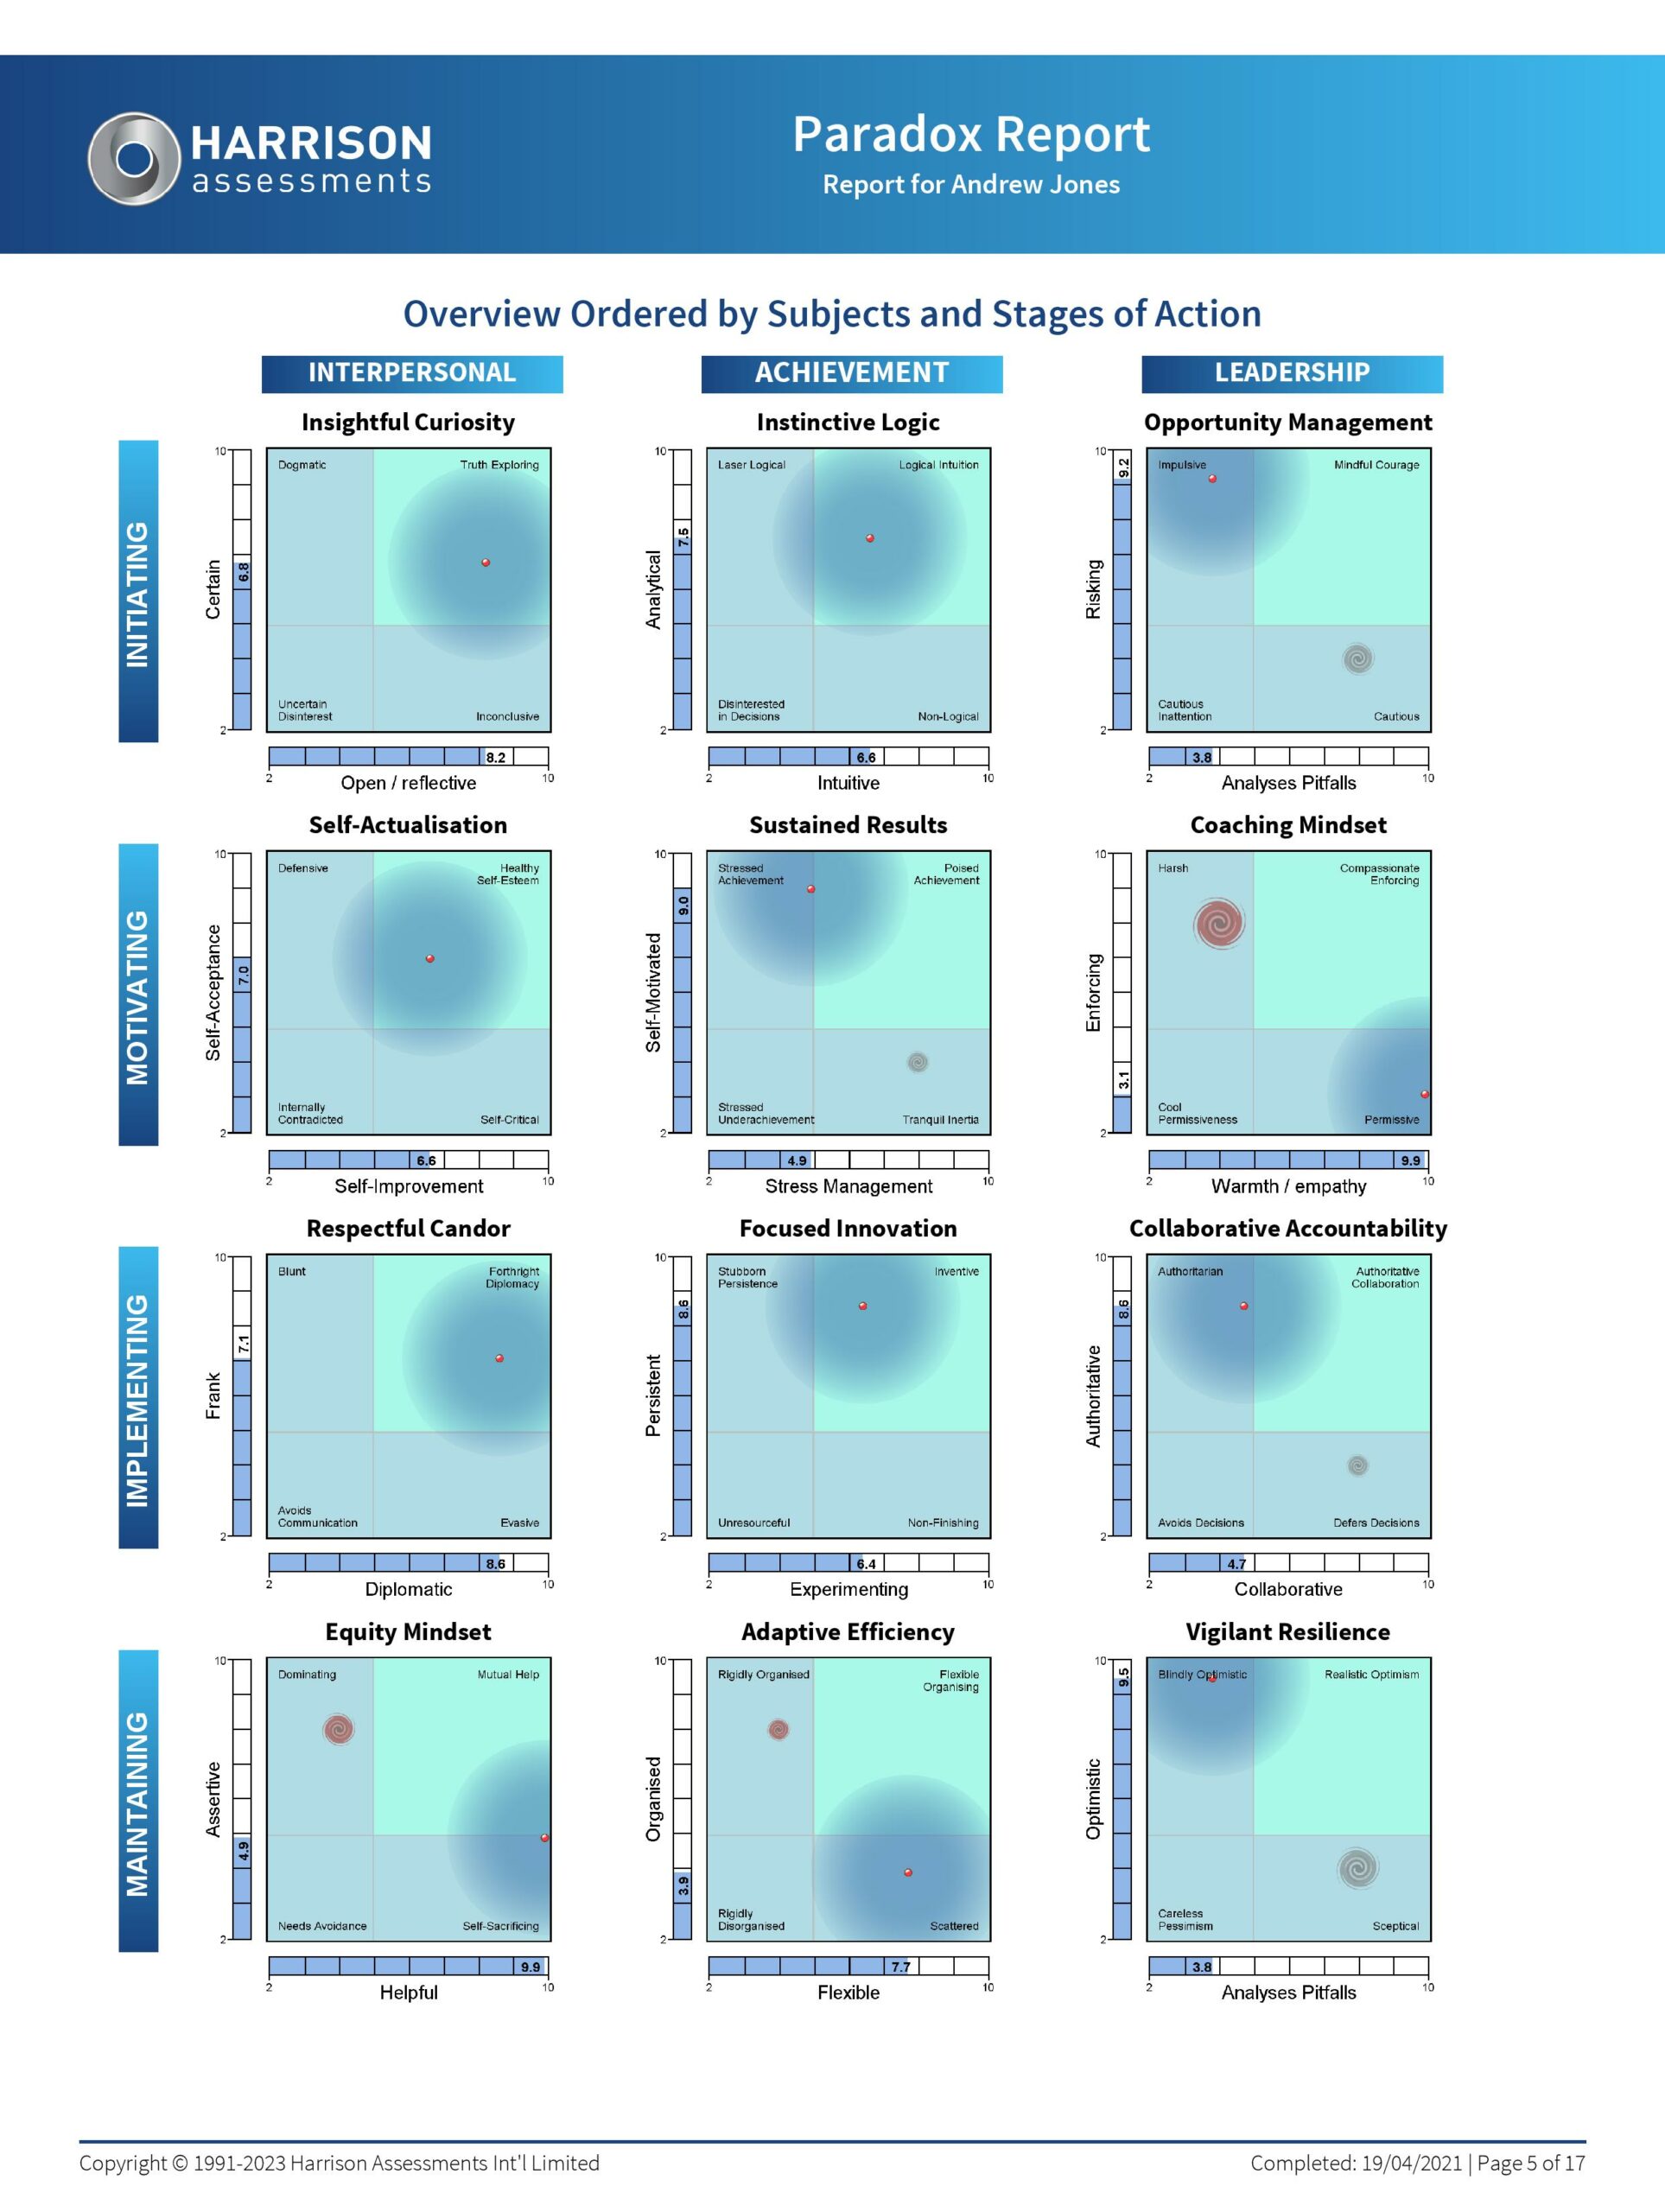
The Harrison Assessment Paradox report explores 12 paradoxical pairs of behaviours, or behaviours which can appear as seemingly opposite. Each of the Paradox graphs has 4 quadrants which demonstrate the potential effects of the balance between the two behaviours.
Every individual will have their own unique set of Paradox patterns; this is a sample report, against an avatar named Andrew Jones. His patterns are indicated by the red dots with the shading around, and the hurricanes, which demonstrate behaviour under stress.
Look at the 12 graphs in the report and the 4 quadrants of each graph…
Ask yourself what do people in each quadrant spend their time doing?
Here are just a few examples –
Insightful Curiosity
(top left)
High Open Reflective, low Certain – people spend their time going round the loop of asking for more opinions/ideas before forming an opinion. This can appear fluffy and indecisive. The opposite, however, may have an equally detrimental effect – people who are sure of their ideas and don’t engage with other viewpoints often spend time mopping up the mess.
Instinctive Logic
(top middle)
High Analytics low Intuitive – someone with this pattern may spend inordinate amounts of time collecting data even when a similar task has been completed before.
Opportunity Management
(top right)
High Analyses Pitfalls low Risking – people get bogged down with all the things that could go wrong, stay in their comfort zone and may spend their time using old methodologies rather than risk a new one. The opposite ie, high Risking low Analyses Pitfalls – can result in more time spent unpicking when things go wrong.
Self-Actualisation
(2nd row left)
High Self-Acceptance low Self Improvement – these people can spend time defending and justifying their own point of view from those who query it. The opposite – Low Self-Acceptance high Self improvement – these people can spend time beating themselves up for all the things that went wrong/could have gone better and are unlikely to recognize their achievements.
Combination patterns
If you look at each of these combinations of paradoxical traits in turn its not difficult to see how people spend their time. Individual Paradoxes can also interrelate between each other to create further patterns of behaviour.
One pattern which is particularly significant is a combination of high Warmth and Empathy (Coaching Mindset paradox) and high Helpful (Equity Mindset paradox). These people spend so much time looking after others, doing their jobs for them etc they often put their own jobs second. They also invariably end up with no time to consider strategic planning in the Opportunity Management paradox (top right).
If you would like to know more about the Harrison Paradox approach and how patterns can help or hinder success do get in touch. pat@quadrant1.com
Several years ago I worked with an organisation who called their UK sales reps into a meeting every Monday morning to report on the previous week. There were at least 30 and each one had to contribute. They were allowed to take their laptops into the meeting so the practice was for each rep to continue working whilst waiting for their turn to speak. Effectively no-one except the Sales Director was actually listening to each presentation. Add up the cost of all these salaries, the travel costs and the cost of lost time potentially speaking with customers and this was an extremely expensive exercise.
Of course, things have changed now – the pandemic has probably been responsible for the explosion in on-line meetings which of course are less time consuming and require less travel. Commendable for all sorts of reasons. So why is it I still hear of people switching off the camera, carrying on with emails, eating their breakfast and, in one case, going to take a bath while the meeting is in progress?
Regular meetings usually lose their flavour after a while and become a chore. I’ve even heard people say ‘Crikey we’ve got XYZ meeting coming up – what are we going to talk about?’ What a complete waste of everyone’s time!
Making Meetings Valuable
The best way to evaluate your proposed meeting is to use the Alignment model as follows –
Purpose
What is this meeting for? What do you want people to DO as a result? If it is just information dumping then send them a report, a spec, product release notes or something else – don’t waste their time in a meeting with all the associated costs.
Identity/Role
Who needs to be there and what role are they playing – facilitator, action taker, expert, learner, explorer. If people don’t have a role to play don’t invite them – they will thank you for it! Equally if you get invited to a meeting where you have no perceived role then have the courage to ask if its necessary for you to be there and what role you will be expected to play.
Values/Beliefs
Is this meeting important and, if so, what is important about it and to whom? What do you believe about the outcomes? Are they positive beliefs or negative? If negative can you reframe them into something positive and look for the possibilities so that you don’t arrive at the meeting as a ‘naysayer’?
Capability
If the stated outcomes for the meeting are agreed upon do you and the organisation have the capability to carry them through? If not what’s missing and how are you going to fill the gap? Do you have the resources to do so?
Behaviour
If you achieve this outcome what behavioural changes would you expect to see in the organisation or team? Are these acceptable and do they add value to the organisation?
Environment
How would achieving this outcome impacted not only your immediate environment, but that of the team, the organisation and even possibly the community?
Taking these few simple steps before setting up a meeting will help you to –
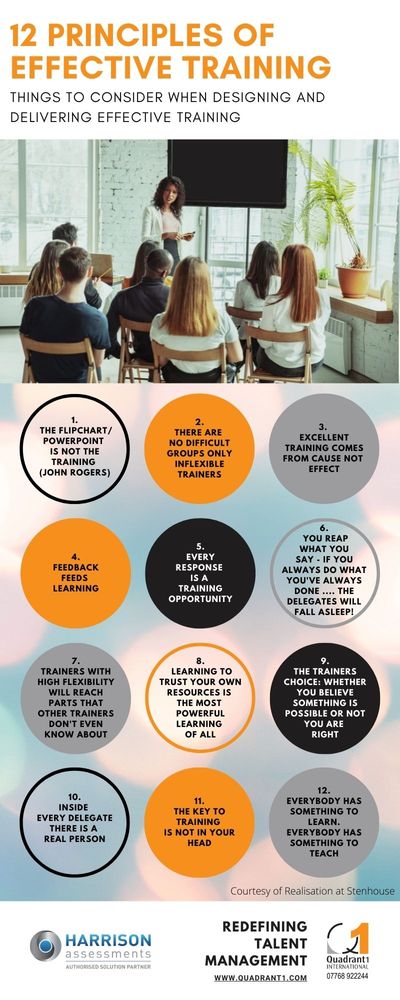
As a trainer of, amongst other things, presentation skills I came across my notes from when I first attended NLP Trainer Training with Realisation at Stenhouse back in the day and found these principles which are oh so relevant still today ……
Click the image to view a larger version and download
The flipchart/Powerpoint is NOT the training (John Rogers)
There are no difficult groups only inflexible trainers
Excellent training comes from CAUSE not Effect
Feedback feeds learning
Every response is a training opportunity
You reap what you Say – If you always do what you’ve always done …. the delegates will fall asleep!
Trainers with high Flexibility will reach parts that other trainers don’t even know about
Learning to trust your own resources is the most powerful learning of all
The trainers choice: whether you believe something is possible or not you are right
Inside every delegate there is a real person
The key to training is NOT in your head
Everybody has something to learn. Everybody has something to teach
Unconsciously I have stuck with these principles during the 20+ years I have been training leaders and managers – they have served me well – thanks Realisation at Stenhouse!
Are you interested in how we can help with developing these and other presentation and communication skills for yourself or your team? Check out our Advanced Presentation Skills wi th NLP course, or please get in touch at pat@quadrant1.com or on 07768 922244
Engaged employees who wholeheartedly give discretionary effort help the organisation succeed.
While employee engagement is now afforded greater focus, energy and resources by most organisations, traditional employee engagement surveys only measure group engagement issues, ignore the individual data that is crucial to engagement, and assumes only their managers are responsible for engagement.
To significantly increase employee engagement you need to understand the passions, motivations, and expectations of the individual, and use an approach which is based around engagement being a shared responsibility between the employee and the organisation.
Using objective data, we can map individual employee’s passions, motivations, expectations and the degree to which their expectations are perceived to be already being fulfilled, against eight essential Engagement metrics:
• Development • Remuneration • Authority • Social
• Appreciation • Communications • Personal • Work Life Balance
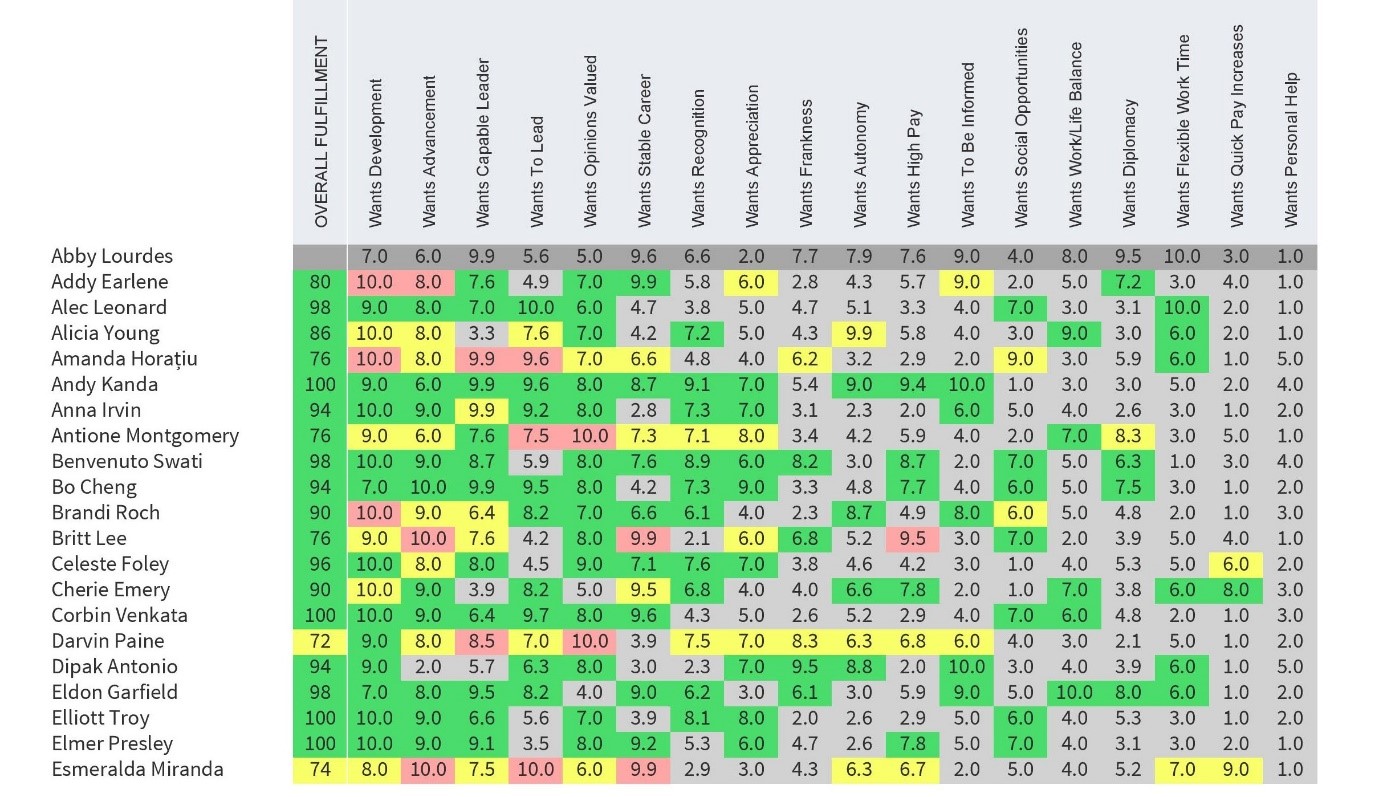
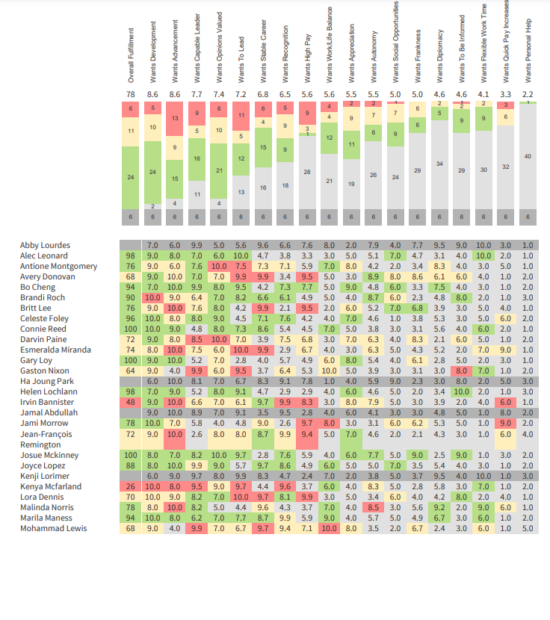
View of top 21 employees alphabetically sorted from a group of 81 employees in total
What does this tell us?
The graph above provides a clear picture of this group of individuals; overall fulfilment scores are predominantly high. This indicates that the majority of these employees feel that the employee expectations which are important to them as individuals are mostly being met.
Do Darvin and Esmerelda appear engaged in their day to day role? Their scores would indicate otherwise, and this will probably be apparent in some way in their behaviours and productivity levels.
Why may Darvin feel like his opinions are not being valued? What may be behind Esmerelda’s apparent lack of fulfilment in her advancement and desire to lead?
Amanda, Antoine and Britt look like it wouldn’t take much for their engagement levels to drop either, and there are some areas where various individuals have rated factors as very important (10’s) which are not being fulfilled and could cause some issues.
The key is to find out what is behind the data
Each of these people – and everyone else in the group – could all benefit from a positive 1-2-1 discussion with their manager to firstly to explore may be behind these scores and to see why they feel their individual expectations are not being fulfilled, and what could be done by their manager, the organisation and they themselves to improve this, and their engagement in their role.
We can also see from the number of high scores afforded across the first 5 expectations – the desire for Development, Advancement, a Capable Leader, To Lead, and to have Opinions Valued, that these seem to be the most often identified as being important to the majority, whereas Quick Pay Increases and Personal Help do not appear to be deemed as important to the individuals in the group.
Room for improvement
The yellow and red areas indicate those expectations that are not necessarily being fulfilled, and can provide a great basis for 2-way conversation firstly to explore may be behind these scores and then to discuss how both parties can improve the situation and benefit from greater engagement. There may be some personal circumstances which are influencing the scores. There could be some simple local solutions in the team which could be implemented, and individual’s feedback could also be useful in feeding into developing wider organisational plans and strategies.
This granular level of in-depth engagement analytics can develop your leaders’ capability to engage their teams and retain top talent. Being able to see how individuals’ values align with your organisation’s business objectives and goals can promote open and engaging discussions and make performance reviews comfortable and productive for everybody.
Understand individual employee’s expectations and the degree to which there are met.
Provide effective engagement intervention for each individual employee by targeting the factors that are important to each employee.
Place employees in roles that are engaging.
Identify how the organisation can help fulfil the employee’s expectations as well as what the employee needs to do.
Understand engagement and fulfilment levels across the business
As well as individual data, an Organisational view enables you to understand collective engagement and fulfilment levels across the business.
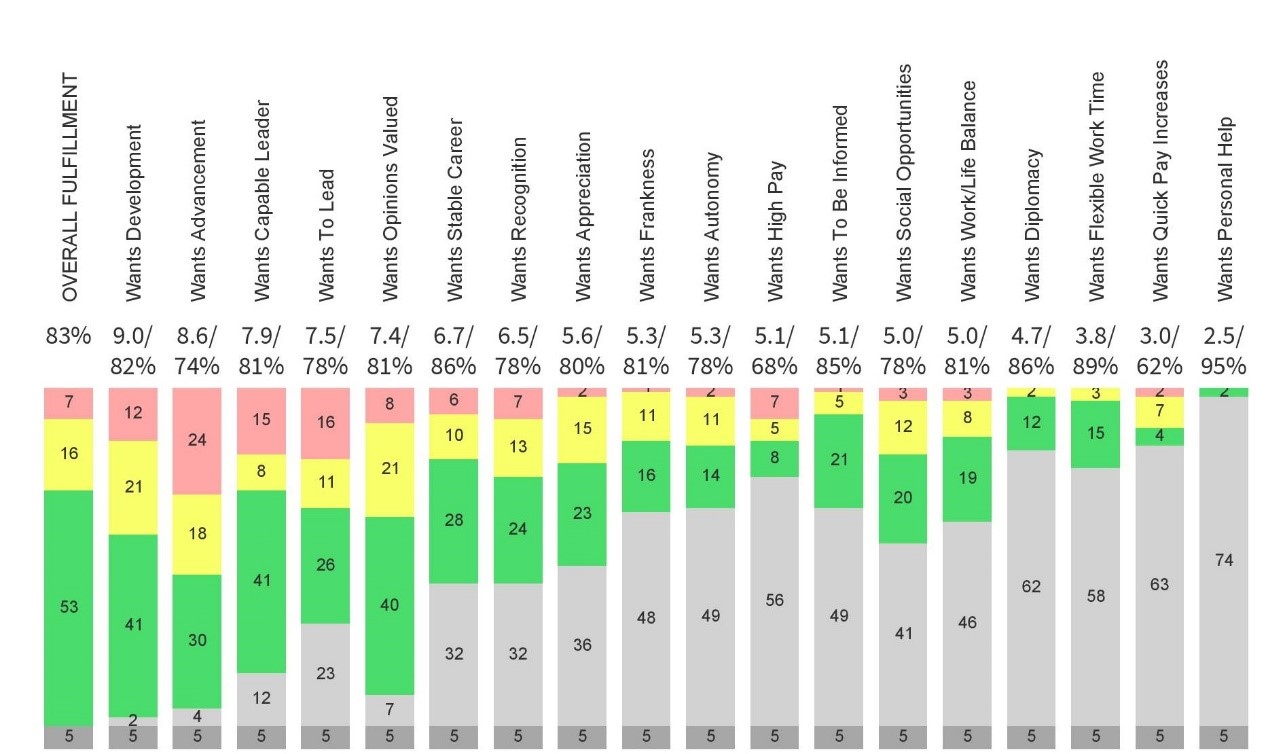
View of employee engagement expectations data from a group of 81 employees in total
Again, we can see clearly that whereas the overall fulfilment of the group of 81 employees is around 2/3rds satisfied, there remains 1 third of expectations unmet.
We can also see that ‘Wants Development’ is the highest placed expectation, and ‘Wants Opinions Valued’ is the most unmet of them all. The grey areas show where those expectations have not been ranked highly, and indicates that flexible work time, quick pay increases and personal help are of little value to this group of individuals.
Explore your data in many different ways
Interactive dashboards allow you to select groups to analyse by department, team, or manager using customisable tags and easily generate reports. A traffic light colour scheme easily identifies any hot spot areas to focus on.
Using advanced organisational analytics such as these for PEOPLE means you can measure, identify, develop, and improve across individuals, groups, teams, business areas and behaviours using global and individual data to support people plans, drive action, and to create a culture of engagement and high performance.
Visualise your Group Data
This is a snapshot of the high-level Organisational Analytics data available just across Employee Engagement Expectations. You can also get data for your people and your organisation on:
Senior and emerging leadership competency
Culture of your organisation
Collaboration and Team competencies
Team Dynamics
Emotional Intelligence competencies
Remote Working competencies
How helpful would this data be for informing your people development plans, culture and engagement programmes and succession plans?
You can find out more about Organisational Analytics here. leaders skills and competencies
If you would like to discuss how Organisational Analytics can help support your business objectives and people plans please contact Pat Hutchinson: pat@quadrant1.com or on 07768 922244


 This is a snapshot of the high-level Organisational Analytics data available just across Employee Engagement Expectations. You can also get data for your people and your organisation on: