In the fast-paced landscape of today’s workplaces, understanding and nurturing employee engagement is paramount for organisational success. At the heart of this endeavour lies Engagement Analytics, a powerful tool that delves into the intricate dynamics between employees and their work environment.
Measuring Expectations, Fostering Fulfilment
Engagement Analytics serves as a compass, guiding organisations through the labyrinth of employee expectations and fulfilment. It meticulously gauges one’s employment expectations and evaluates the extent to which they are met within the organisational framework.
Imagine having a panoramic view of your workforce’s sentiments, aspirations, and contentment levels. The Organisational View for Engagement encapsulates this essence effectively.
From frontline employees to C-suite executives, Engagement Analytics paves the way for tailored engagement strategies that resonate with each individual. By leveraging data-driven insights, organizations can craft initiatives that address specific pain points, foster a culture of inclusion, and nurture a sense of belonging among their workforce.
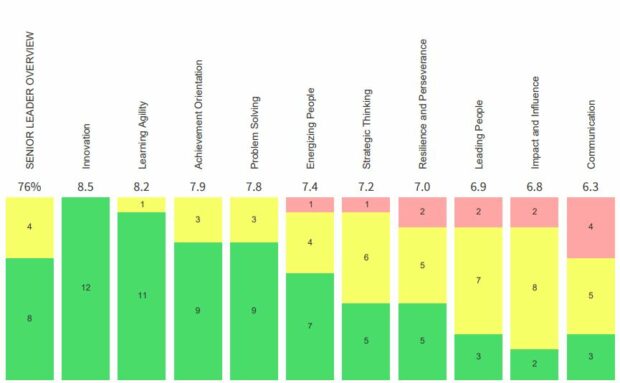
How many departmental heads and team leaders would like to have the type of employee engagement expectation data shown in the attached graph? Good staff are expensive to replace – finding ways to keep them is crucial for productivity, keeping costs down and generally enhancing cultures to create attractive working environments. Expectations are divided into 8 groups, and participants are invited to score their degree of satisfaction within each group. This gives the team leader the opportunity to have a progressive coaching discussion and has the added impact of showing employees that managers are looking after their interests. The result – open, collaborative cultures with real employee expectations being met as far as humanly possible.
Visualise your Group Data
This is a snapshot of the high-level Organisational Analytics data available just across Employee Engagement Expectations. You can also get data for your people and your organisation on:
Senior and emerging leadership competency
Culture of your organisation
Collaboration and Team competencies
Team Dynamics
Emotional Intelligence competencies
Remote Working competencies
How helpful would this data be for informing your people development plans, culture and engagement programmes and succession plans?
You can find out more about Organisational Analytics here. leaders skills and competencies
If you would like to discuss how Organisational Analytics can help support your business objectives and people plans please contact Pat Hutchinson: pat@quadrant1.com or on 07768 922244
When was the last time someone betrayed your trust? I bet you remember it clearly. You will have experienced a series of emotions – first of all hurt then maybe anger, shock, frustration, annoyance at having trusted in the first place or maybe even pity that the person/organization was put in that position in the first place due to unforeseen circumstances. Whatever the emotional reaction there will have been some change in behaviour, however minute. As a result you may have decided –
Never to trust that person/organization again
Seek revenge or retaliate in some way
Carry on but tread carefully
Tell everyone you know this person/organization can’t be trusted in an attempt to protect your circle of employees, friends etc.
Outcome vs Value
So what happened? In his excellent article of 23rd March 2023 Payton Shand advocates that Trust should be an outcome not a value. He argues that everything the company/person does should be geared towards building trust. Trusting without first testing the water would appear to be rather foolish and can catch us out.
It’s probably true to say that we formulate our approach to trust based on our own perception of it – “I wouldn’t do it so don’t expect anyone else to” which can be open to mis-interpretation and mis-understanding.
Often trust is broken when a more important value comes into play. We see this in governments all the time in the form of broken manifestos and in companies when profit is threatened.
Organisational values
Companies often pride themselves in including ‘Trust’ or ‘Trustworthiness’ in their company values but what does it actually mean? The question to ask is ‘if I was to walk round your organization and see everyone behaving in a trustworthy manner, what would that look like?’ Trust me to do what exactly?
Get to work on time?
Meet deadlines and targets?
Not to overspend on budget?
Be kind and considerate to my colleagues?
Always own up when something goes wrong?
Keep my word?
Keep the office surroundings tidy?
Call out inappropriate behaviour?
Trustworthiness will very definitely mean different things to different people and will almost certainly be called out when another value takes over. Define it clearly and make it an outcome not a value!
I often get asked to run time management courses. Managing time should be easy – write a list of things to do and get on and do them. So what gets in the way?
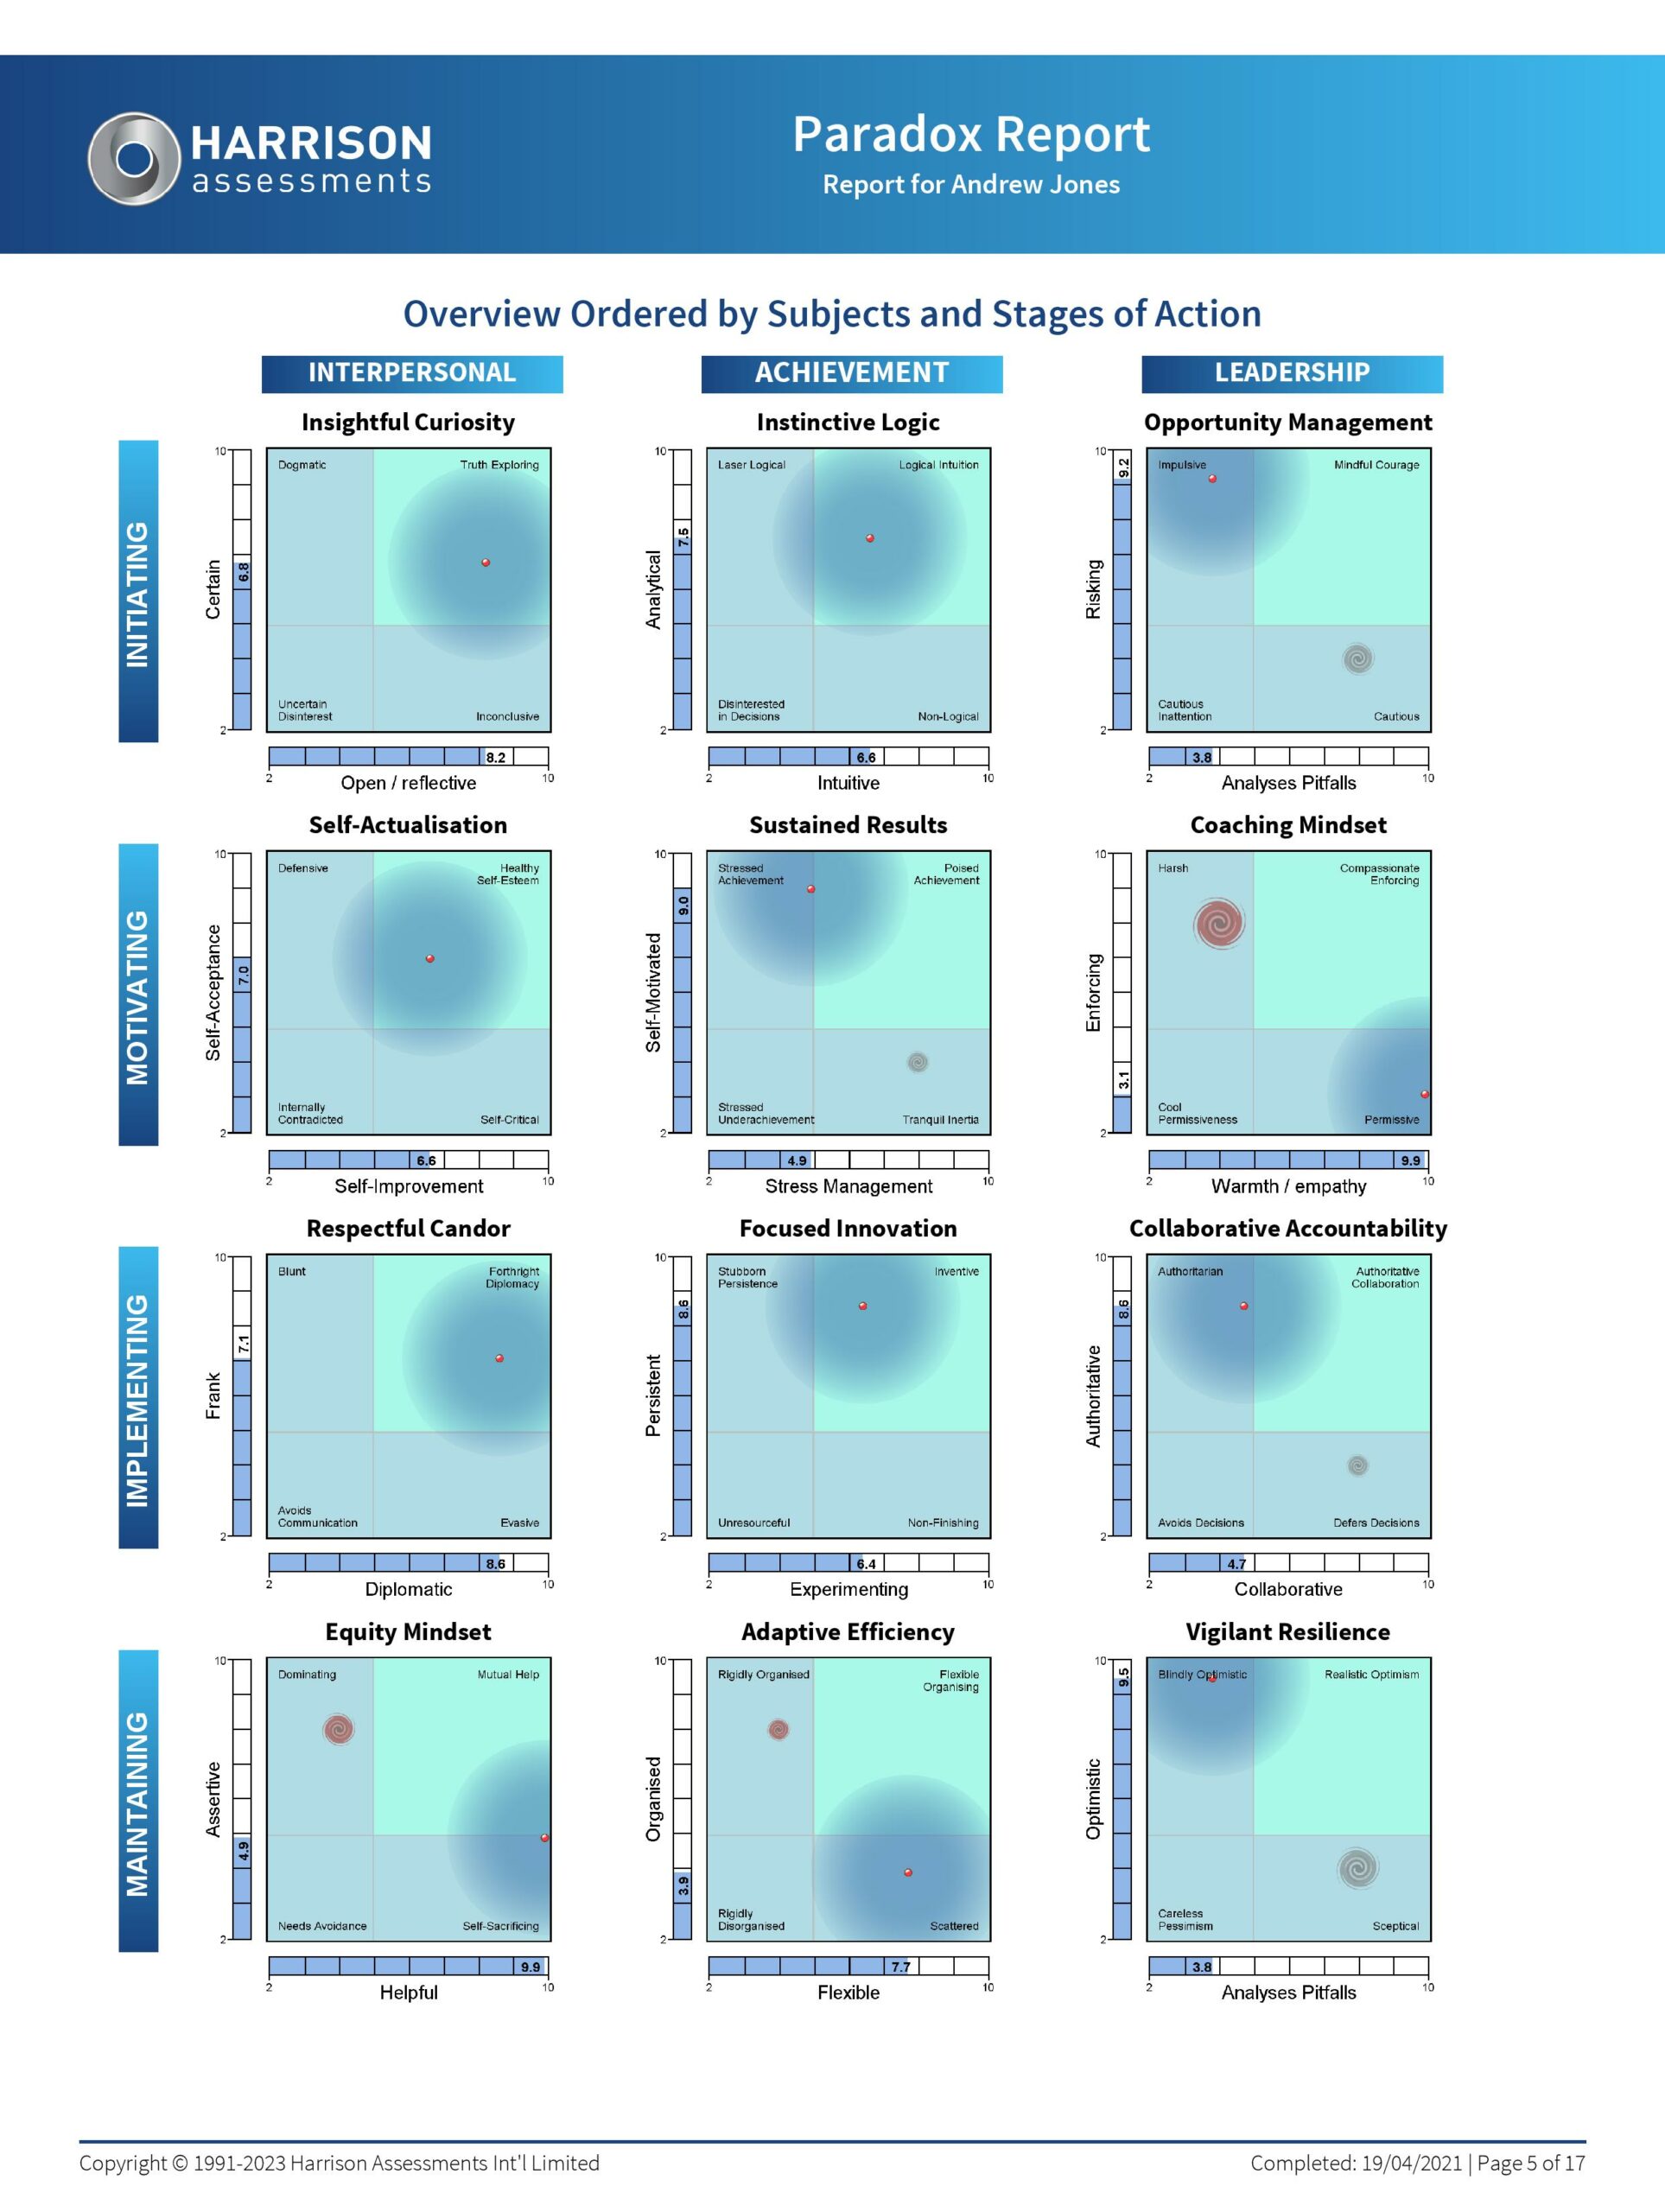
Take a look at this Paradox graph –
Harrison Assessment Paradox report
The Harrison Assessment Paradox report explores 12 paradoxical pairs of behaviours, or behaviours which can appear as seemingly opposite. Each of the Paradox graphs has 4 quadrants which demonstrate the potential effects of the balance between the two behaviours.
Every individual will have their own unique set of Paradox patterns; this is a sample report, against an avatar named Andrew Jones. His patterns are indicated by the red dots with the shading around, and the hurricanes, which demonstrate behaviour under stress.
Look at the 12 graphs in the report and the 4 quadrants of each graph…
Ask yourself what do people in each quadrant spend their time doing?
Here are just a few examples –
Insightful Curiosity
(top left)
High Open Reflective, low Certain – people spend their time going round the loop of asking for more opinions/ideas before forming an opinion. This can appear fluffy and indecisive. The opposite, however, may have an equally detrimental effect – people who are sure of their ideas and don’t engage with other viewpoints often spend time mopping up the mess.
Instinctive Logic
(top middle)
High Analytics low Intuitive – someone with this pattern may spend inordinate amounts of time collecting data even when a similar task has been completed before.
Opportunity Management
(top right)
High Analyses Pitfalls low Risking – people get bogged down with all the things that could go wrong, stay in their comfort zone and may spend their time using old methodologies rather than risk a new one. The opposite ie, high Risking low Analyses Pitfalls – can result in more time spent unpicking when things go wrong.
Self-Actualisation
(2nd row left)
High Self-Acceptance low Self Improvement – these people can spend time defending and justifying their own point of view from those who query it. The opposite – Low Self-Acceptance high Self improvement – these people can spend time beating themselves up for all the things that went wrong/could have gone better and are unlikely to recognize their achievements.
Combination patterns
If you look at each of these combinations of paradoxical traits in turn its not difficult to see how people spend their time. Individual Paradoxes can also interrelate between each other to create further patterns of behaviour.
One pattern which is particularly significant is a combination of high Warmth and Empathy (Coaching Mindset paradox) and high Helpful (Equity Mindset paradox). These people spend so much time looking after others, doing their jobs for them etc they often put their own jobs second. They also invariably end up with no time to consider strategic planning in the Opportunity Management paradox (top right).
If you would like to know more about the Harrison Paradox approach and how patterns can help or hinder success do get in touch. pat@quadrant1.com
What Makes HR Look Good in the Board Room – if indeed they even get there!
Its easy to see the results of the Sales Director, the Operations Director and to review the numbers of the Finance Director. These things are tangible and measurable and tend to receive the majority of the Board Room focus because of this very nature.
Most organisations will tell you that their people are the most important resource they have and that looking after them and developing them is paramount. So why is it that the person who is Head of HR is often not represented on the Board and if they are, they often have to shout loudly to be heard?
The answer may be contained in just one word: ‘evidence’. People are not machines; they cannot be counted as a stock number and additionally, unlike stock, they have a thing called choice!
There are no norms – all people are exceptions to a rule that doesn’t exist
Fernando Pessoa – Late 19th Century Portuguese Poet
Hence HR people are often left with unquantifiable results. Being experts in their own field they can see what strategic decisions have to be made in relation to developing a productive, engaged workforce but with no statistical evidence this can be hard to justify.
Dan Harrison’s 30+ years of research into what makes people successful in the workplace, in particular roles and working in particular teams now gives us the very analytics needed to:
Identify the success behaviours required to perform in a particular role
Produce profiles against which to recruit successful candidates
Assess for leadership, BCs, values-based behaviours, remote working EI and much more
Conduct progressive engagement surveys upon which to make strategic engagement decisions as well as individual ones
Armed with such analytics, the HR professional stands a much better chance of making effective business cases in the Board Room!
If you would like to know more click here, or please contact me at pat@quadrant1.com
Engaged employees who wholeheartedly give discretionary effort help the organisation succeed.
While employee engagement is now afforded greater focus, energy and resources by most organisations, traditional employee engagement surveys only measure group engagement issues, ignore the individual data that is crucial to engagement, and assumes only their managers are responsible for engagement.
To significantly increase employee engagement you need to understand the passions, motivations, and expectations of the individual, and use an approach which is based around engagement being a shared responsibility between the employee and the organisation.
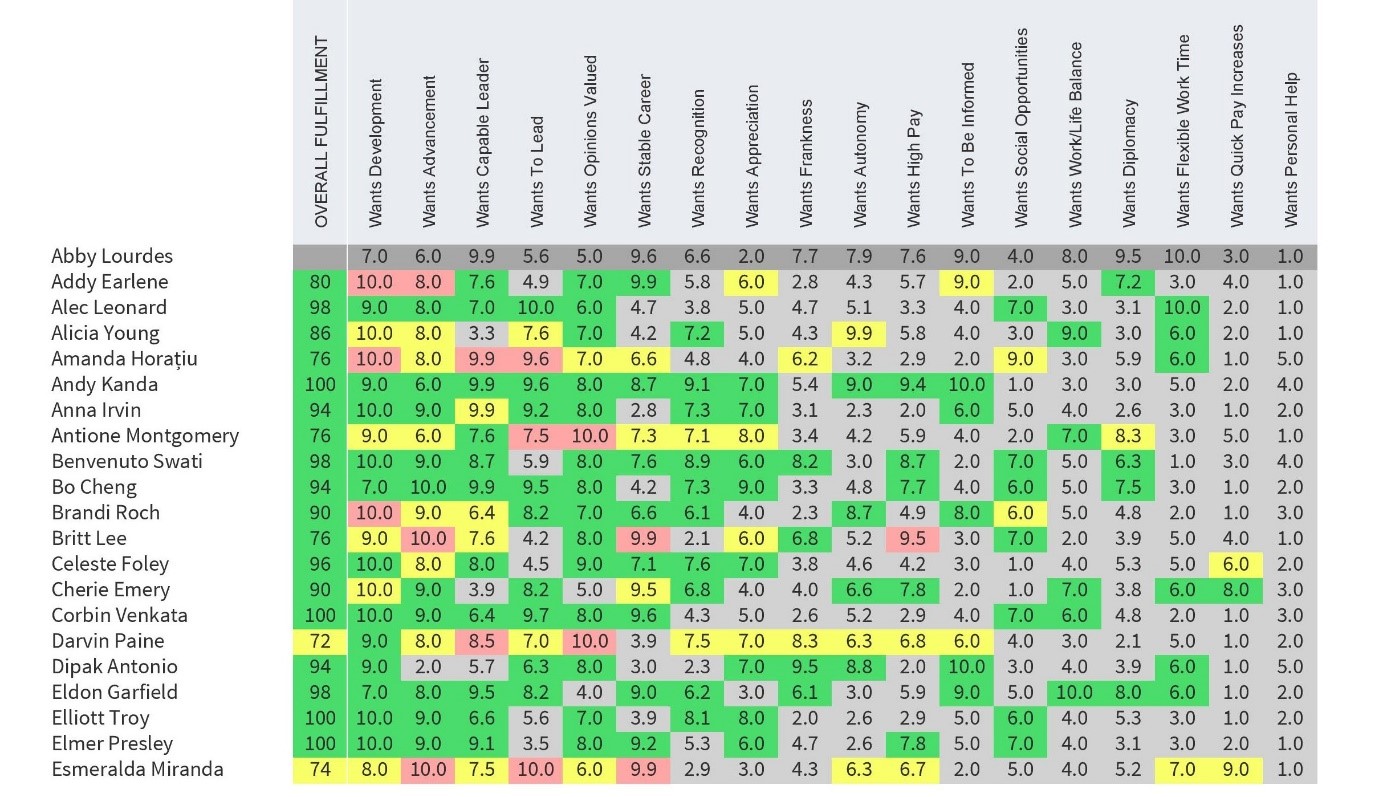
Using objective data, we can map individual employee’s passions, motivations, expectations and the degree to which their expectations are perceived to be already being fulfilled, against eight essential Engagement metrics:
• Development • Remuneration • Authority • Social
• Appreciation • Communications • Personal • Work Life Balance
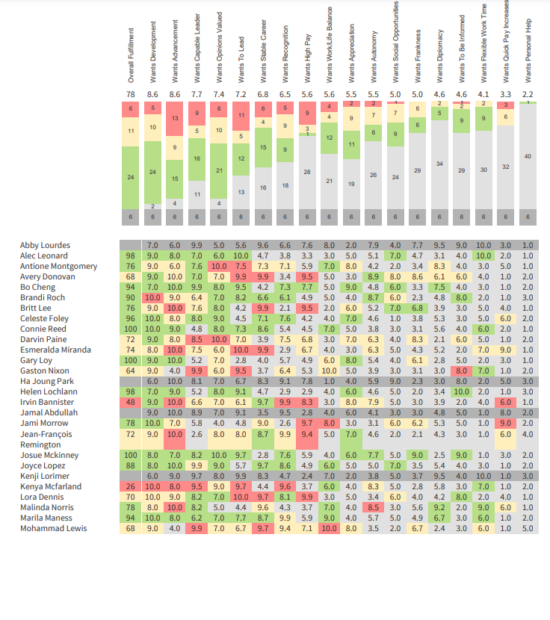
View of top 21 employees alphabetically sorted from a group of 81 employees in total
What does this tell us?
The graph above provides a clear picture of this group of individuals; overall fulfilment scores are predominantly high. This indicates that the majority of these employees feel that the employee expectations which are important to them as individuals are mostly being met.
Do Darvin and Esmerelda appear engaged in their day to day role? Their scores would indicate otherwise, and this will probably be apparent in some way in their behaviours and productivity levels.
Why may Darvin feel like his opinions are not being valued? What may be behind Esmerelda’s apparent lack of fulfilment in her advancement and desire to lead?
Amanda, Antoine and Britt look like it wouldn’t take much for their engagement levels to drop either, and there are some areas where various individuals have rated factors as very important (10’s) which are not being fulfilled and could cause some issues.
The key is to find out what is behind the data
Each of these people – and everyone else in the group – could all benefit from a positive 1-2-1 discussion with their manager to firstly to explore may be behind these scores and to see why they feel their individual expectations are not being fulfilled, and what could be done by their manager, the organisation and they themselves to improve this, and their engagement in their role.
We can also see from the number of high scores afforded across the first 5 expectations – the desire for Development, Advancement, a Capable Leader, To Lead, and to have Opinions Valued, that these seem to be the most often identified as being important to the majority, whereas Quick Pay Increases and Personal Help do not appear to be deemed as important to the individuals in the group.
Room for improvement
The yellow and red areas indicate those expectations that are not necessarily being fulfilled, and can provide a great basis for 2-way conversation firstly to explore may be behind these scores and then to discuss how both parties can improve the situation and benefit from greater engagement. There may be some personal circumstances which are influencing the scores. There could be some simple local solutions in the team which could be implemented, and individual’s feedback could also be useful in feeding into developing wider organisational plans and strategies.
This granular level of in-depth engagement analytics can develop your leaders’ capability to engage their teams and retain top talent. Being able to see how individuals’ values align with your organisation’s business objectives and goals can promote open and engaging discussions and make performance reviews comfortable and productive for everybody.
Understand individual employee’s expectations and the degree to which there are met.
Provide effective engagement intervention for each individual employee by targeting the factors that are important to each employee.
Place employees in roles that are engaging.
Identify how the organisation can help fulfil the employee’s expectations as well as what the employee needs to do.
Understand engagement and fulfilment levels across the business
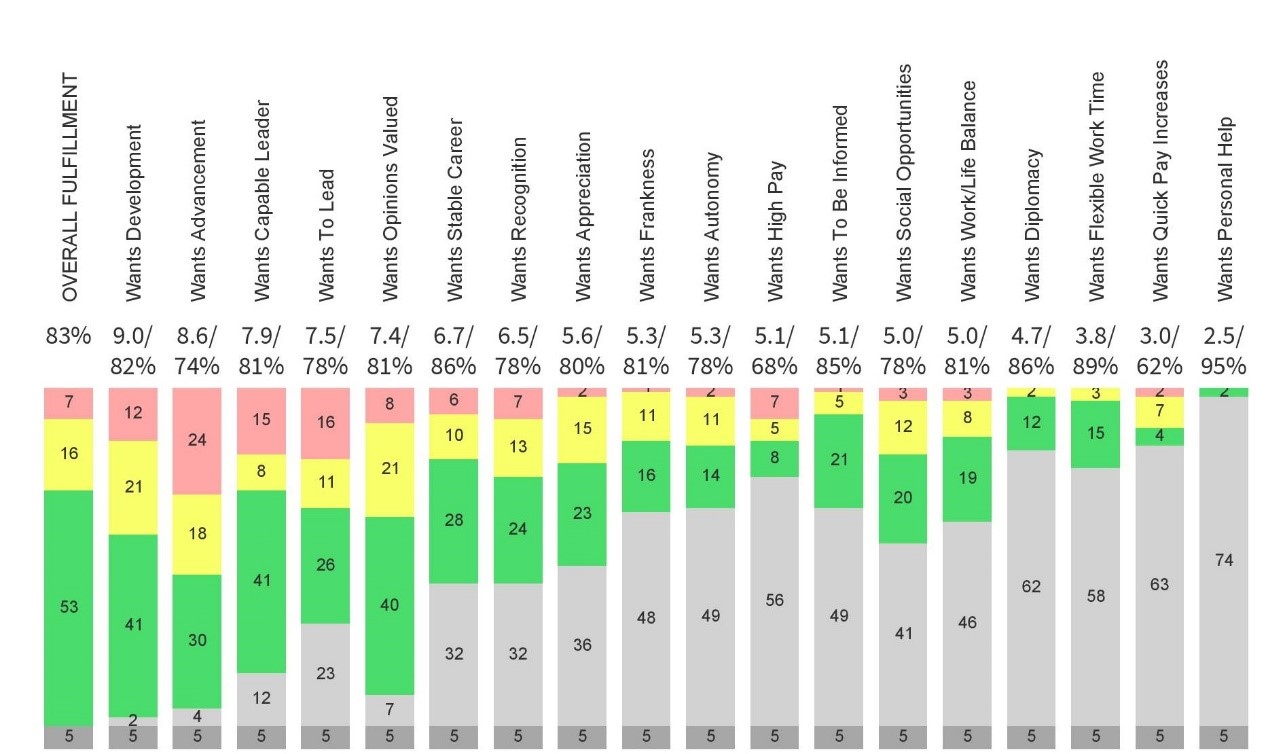
As well as individual data, an Organisational view enables you to understand collective engagement and fulfilment levels across the business.
View of employee engagement expectations data from a group of 81 employees in total
Again, we can see clearly that whereas the overall fulfilment of the group of 81 employees is around 2/3rds satisfied, there remains 1 third of expectations unmet.
We can also see that ‘Wants Development’ is the highest placed expectation, and ‘Wants Opinions Valued’ is the most unmet of them all. The grey areas show where those expectations have not been ranked highly, and indicates that flexible work time, quick pay increases and personal help are of little value to this group of individuals.
Explore your data in many different ways
Interactive dashboards allow you to select groups to analyse by department, team, or manager using customisable tags and easily generate reports. A traffic light colour scheme easily identifies any hot spot areas to focus on.
Using advanced organisational analytics such as these for PEOPLE means you can measure, identify, develop, and improve across individuals, groups, teams, business areas and behaviours using global and individual data to support people plans, drive action, and to create a culture of engagement and high performance.
Visualise your Group Data
This is a snapshot of the high-level Organisational Analytics data available just across Employee Engagement Expectations. You can also get data for your people and your organisation on:
Senior and emerging leadership competency
Culture of your organisation
Collaboration and Team competencies
Team Dynamics
Emotional Intelligence competencies
Remote Working competencies
How helpful would this data be for informing your people development plans, culture and engagement programmes and succession plans?
You can find out more about Organisational Analytics here. leaders skills and competencies
If you would like to discuss how Organisational Analytics can help support your business objectives and people plans please contact Pat Hutchinson: pat@quadrant1.com or on 07768 922244


 This is a snapshot of the high-level Organisational Analytics data available just across Employee Engagement Expectations. You can also get data for your people and your organisation on:
 When was the last time someone betrayed your trust? I bet you remember it clearly. You will have experienced a series of emotions – first of all hurt then maybe anger, shock, frustration, annoyance at having trusted in the first place or maybe even pity that the person/organization was put in that position in the first place due to unforeseen circumstances. Whatever the emotional reaction there will have been some change in behaviour, however minute. As a result you may have decided –